8 Wastes of Lean Manufacturing: The Hidden Profit Killers for Manufacturers

What if I told you that your factory is probably bleeding money every single day, and you might not even realise it?
Walk into any manufacturing plant in Pune, Chennai, or Gurgaon, and you'll witness a fascinating contradiction. On one hand, there are sophisticated machines humming with precision, skilled workers executing complex processes, and quality control systems ensuring products meet international standards.
On the other hand, there's often invisible waste lurking in every corner. There is excessive inventory gathering dust, workers walking unnecessary distances, defective products being reworked, and valuable employee insights going unheard.
This is the reality that every production environment faces until it discovers the power of lean manufacturing principles.
The concept of 8 wastes of lean manufacturing has changed how companies worldwide approach efficiency and the remarkable results they are witnessing. Do you want to learn more about the 8 types of waste in lean? Let’s get digging.
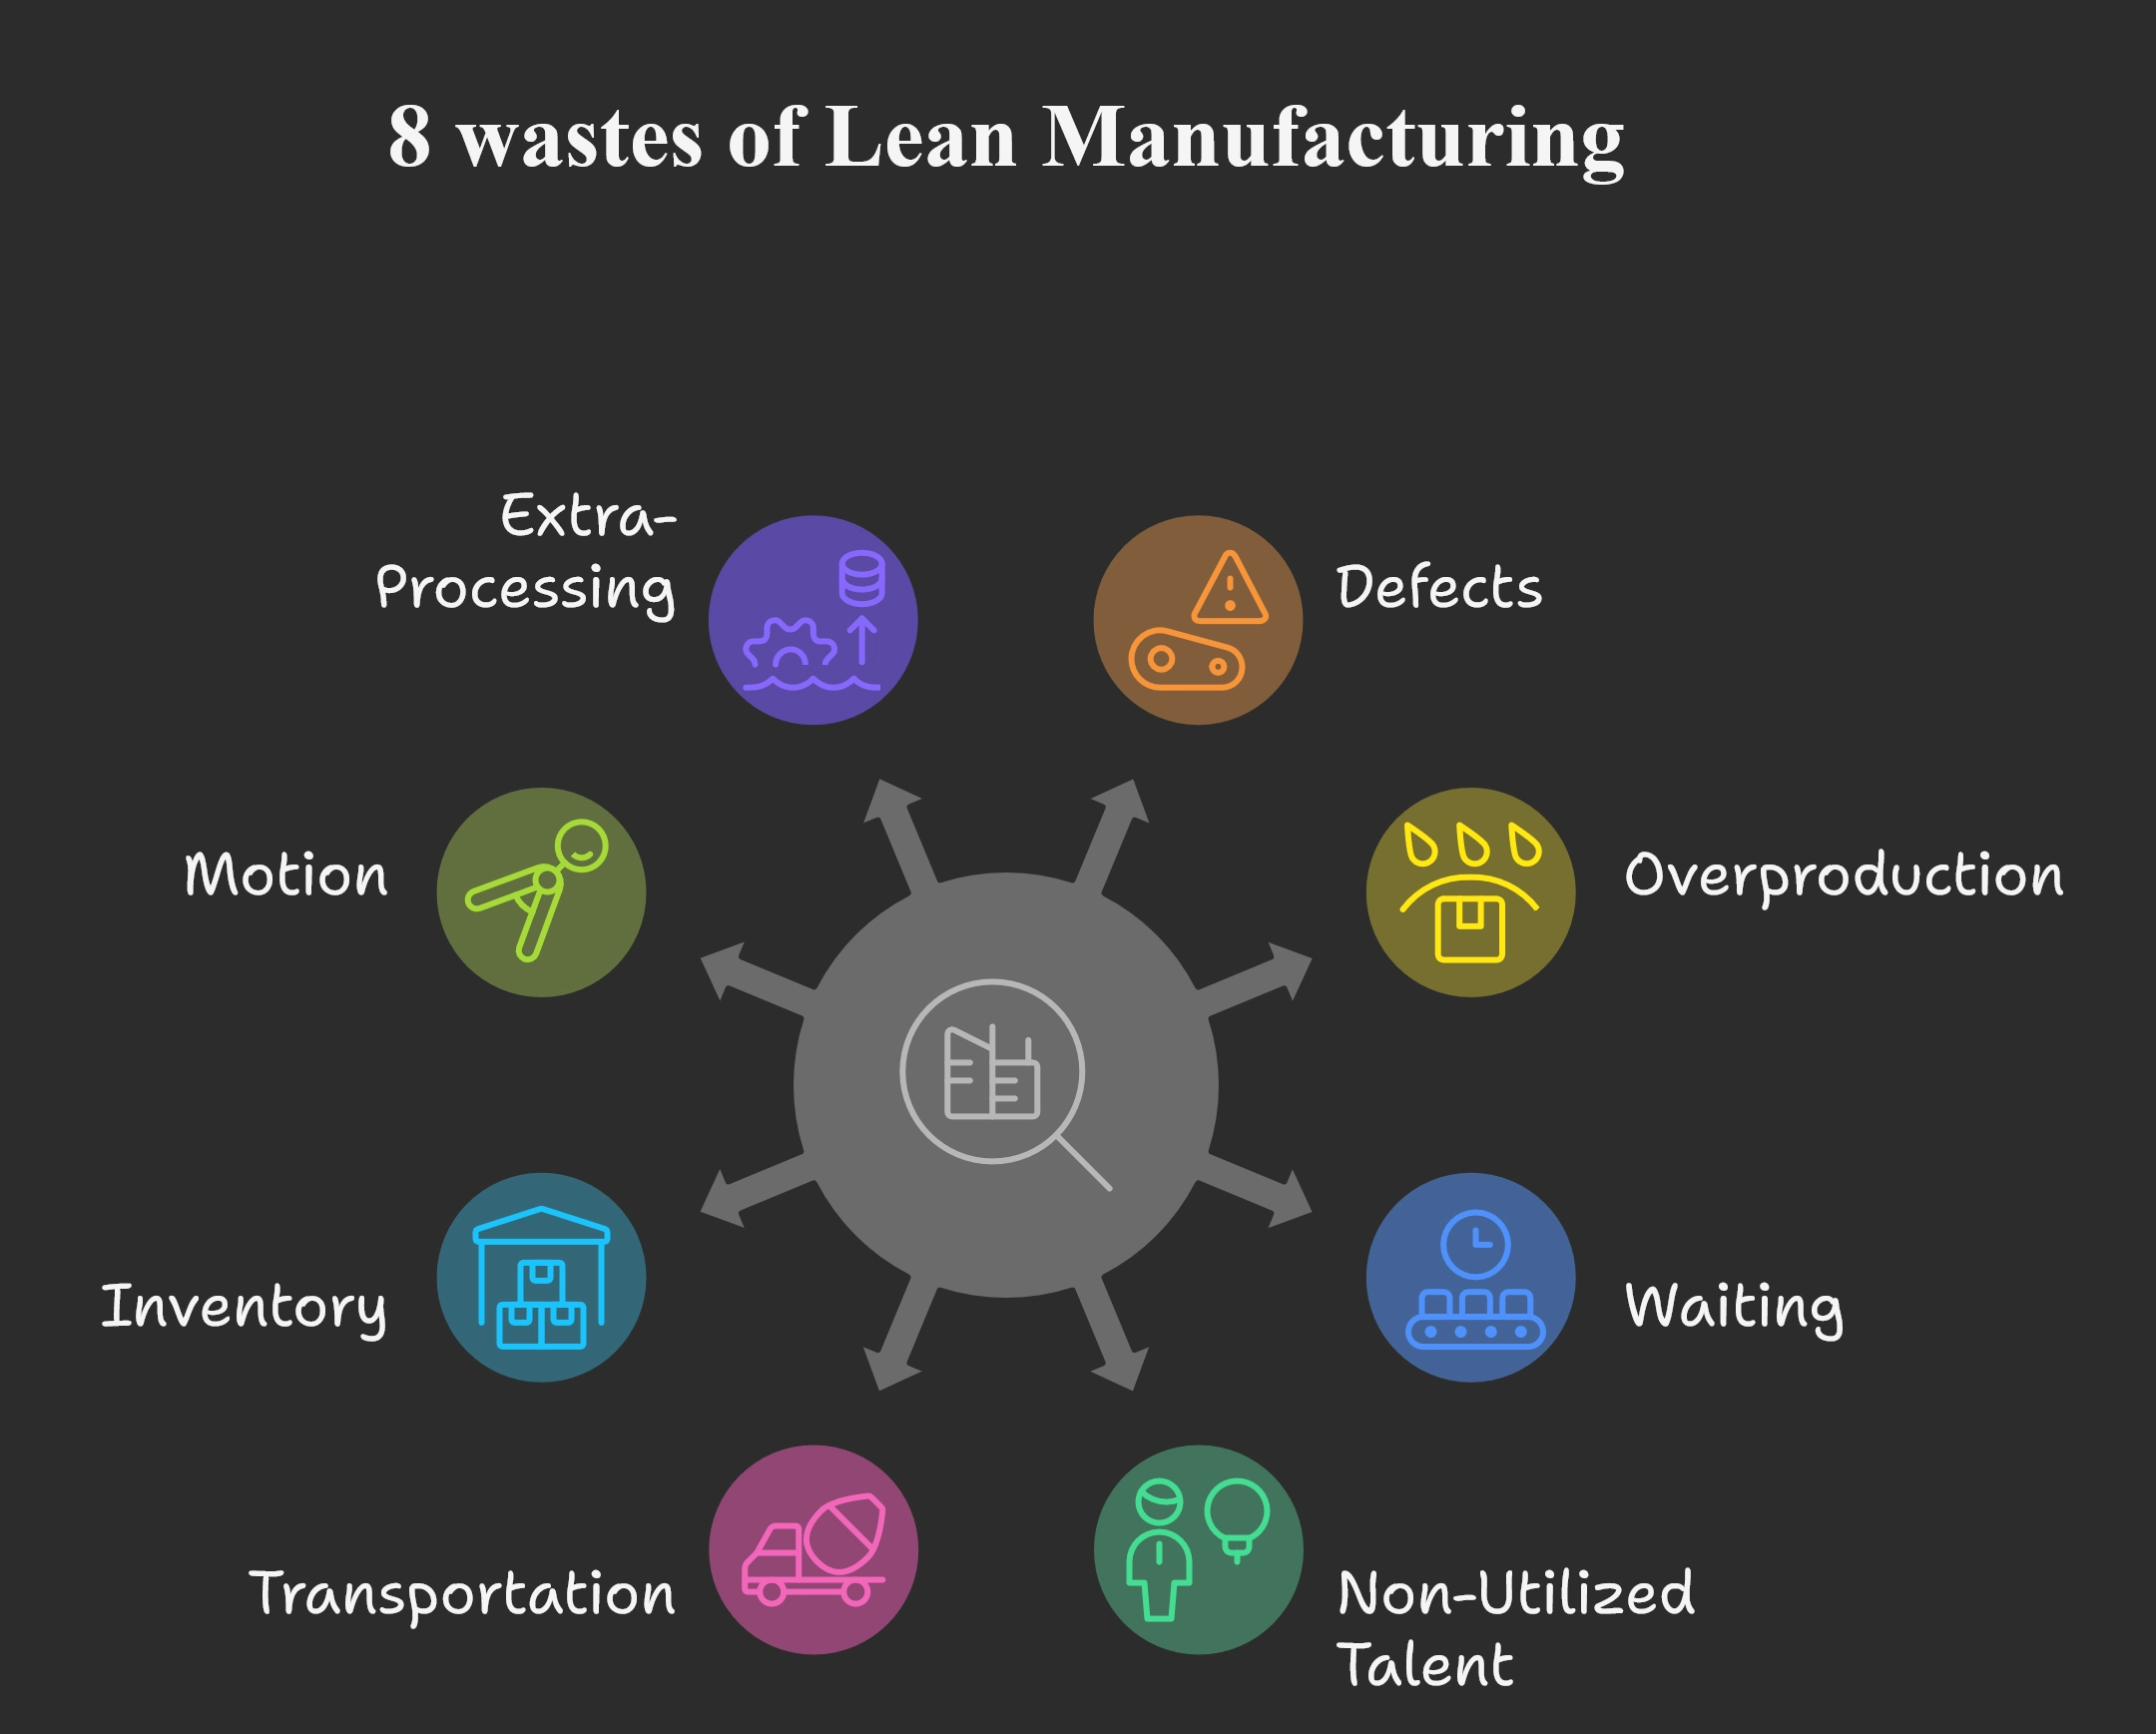
What are the 8 wastes of lean manufacturing?
Before we dive into the specifics, let's address the fundamental question: what exactly constitutes waste in lean manufacturing?
Simply put, waste is any activity that consumes resources, such as time, materials, energy, or human effort. Moreover, this happens without adding value that customers are willing to pay for. If your customer wouldn't happily pay extra for a particular step in your process, it's likely a waste.
The original framework identified 7 wastes of lean, but as methodologies spread beyond Japan, an 8th waste in lean was added to address the uniquely human element that often gets overlooked.
These 8 wastes of lean manufacturing are commonly remembered using two popular acronyms:
DOWNTIME waste: Defects, Overproduction, Waiting, Non-utilised talent, Transportation, Inventory, Motion, Extra-processing.
TIMWOOD waste: Transportation, Inventory, Motion, Waiting, Overproduction, Overprocessing, Defects (with Skills sometimes added as TIMWOODS).
Both acronyms describe the same fundamental inefficiencies, so pick whichever one your team finds easier to remember and use it consistently.
Types of Waste in Lean Manufacturing Explained: How to become more efficient?
Let's examine each waste in detail, exploring how they impact typical Indian manufacturing environments and what you can do about them.
1. Defects - The quality killer
What does defect waste look like in your facility? It's any product or component that doesn't meet specifications on the first attempt, requiring rework, repair, or complete scrapping.
In Indian manufacturing contexts, this might include:
- Components failing quality checks due to inconsistent raw material quality
- Products requiring rework because of unclear work instructions
- Customer returns due to cosmetic or functional defects
- Inspection failures that could have been prevented earlier in the process
How to eliminate defects: Focus on prevention rather than detection.
Implement error-proofing (poka-yoke) techniques, create visual work standards that are impossible to misunderstand, and establish layered audits where quality checks happen at multiple points.
Use AI and ML in manufacturing for vision-based inspection and auto-classification to catch errors in-station.
2. Overproduction - The resource trap
This might be the most dangerous waste because it seems productive on the surface. Overproduction occurs when you manufacture items before they're actually needed, or in quantities exceeding immediate demand.
Why do Indian manufacturers fall into this trap? Often it's because:
- "We need to keep the expensive machine running"
- "Raw material prices might increase next month"
- "We want to be ready for unexpected orders"
- "Setup costs are high, so we might as well make large batches"
The hidden costs: Overproduced items require storage space, handling, inventory tracking, and often become obsolete before they can be used. They also hide other problems - if you're making huge batches, you won't notice quality issues until you've already produced hundreds of defective units.
The solution: Implement pull-based production systems where you only make what the next process actually needs. This requires better demand forecasting, smaller batch sizes, and often some mindset shifts about how to measure productivity.
3. Waiting - The productivity killer
Waiting waste occurs whenever people or machines are idle due to delays, shortages, or bottlenecks.
In manufacturing, common examples include:
- Operators waiting for material deliveries
- Machines sitting idle during extended changeovers
- Products waiting in queues between processes
- Teams waiting for approvals or technical clarifications
Measuring the impact: Use Overall Equipment Effectiveness (OEE) metrics to understand how much of your available production time is actually being used productively.
Elimination strategies: Reduce changeover times using Single-Minute Exchange of Die (SMED) techniques, cross-train operators to handle multiple processes, and remove approval bottlenecks that don't add genuine value.
4. Non-utilised talent - The innovation waste
This is perhaps the most tragic waste because it represents lost opportunities for improvement. It happens when organisations fail to tap into their employees' knowledge, creativity, and problem-solving abilities.
In manufacturing contexts, this often shows up as:
- Operators who know exactly how to improve a process but are never asked
- Engineers whose suggestions get lost in bureaucratic layers
- Experienced workers whose knowledge isn't documented or shared
- Teams that aren't empowered to stop production when they spot problems
The opportunity: Companies that effectively engage their workforce typically see 10-15 implemented improvement ideas per employee per year.
Unlocking potential: Create structured suggestion systems, implement daily improvement meetings (kaizen), and ensure that good ideas get implemented quickly with recognition for contributors.
Tighten client relationships in manufacturing to turn customer feedback into kaizen ideas your teams can ship quickly.
5. Transportation - The movement waste
Transportation waste involves unnecessary movement of materials, components, or products. This is particularly relevant in manufacturing due to:
- Factory layouts that weren't optimally designed
- Multiple facility locations requiring inter-plant transfers
- Suppliers located far from production facilities
- Complex logistics due to infrastructure challenges
Reduction strategies: Use value stream mapping to visualise material flows, design cellular manufacturing layouts, establish point-of-use storage, and optimise supplier locations. See supply chain optimisation in action for how routing cuts internal travel and hand-offs.
6. Inventory - The cash flow burden
Inventory waste occurs when you have more raw materials, work-in-process, or finished goods than necessary to maintain smooth operations.
While some inventory is essential, excess inventory:
- Ties up working capital that could be used elsewhere
- Requires storage space and handling resources
- Risks becoming obsolete or damaged
- Hides underlying process problems
Optimisation approach: Implement just-in-time principles, improve demand forecasting accuracy, work closely with suppliers to reduce lead times, and use kanban systems to maintain optimal inventory levels.
7. Motion - The ergonomic waste
Motion waste refers to any unnecessary movement by operators or equipment that doesn't add value. This includes:
- Workers walking excessive distances to retrieve tools or materials
- Reaching, bending, or stretching in awkward positions
- Searching for items that aren't properly organised
- Equipment that moves unnecessarily between operations
The dual impact: Motion waste not only reduces productivity but also increases the risk of worker fatigue and injury. Additionally leading to additional costs related to ergonomic issues and potentially higher accident rates.
Elimination methods: Implement 5S workplace organisation, design workstations within ergonomic envelopes, use shadow boards for tool organisation, and arrange equipment to minimise movement requirements.
8. Extra-processing - The complexity waste
The eighth waste considered in lean is also known as overprocessing. This waste occurs when you add steps, features, or complexity that customers don't value or need.
Common examples of the 8th waste in lean include:
- Finishing products to tighter tolerances than required
- Multiple approval layers that don't add genuine value
- Duplicate data entry or record-keeping
- Over-engineering solutions when simpler alternatives would work
Streamlining approach: Regularly review specifications to ensure they match actual customer requirements, eliminate redundant approvals, and automate repetitive administrative tasks.
An integrated operating model also removes duplicate data entry by connecting MES, ERP, and work-instruction tools.
Understanding root causes: The 3M model
Here's something crucial that many people miss when they first encounter the 8 wastes of lean manufacturing - these wastes are often symptoms of deeper problems rather than root causes themselves.
Lean manufacturing experts use a framework called the 3M model to understand these underlying issues:
- Mura (Unevenness): Irregular demand, inconsistent workflows, or unbalanced production schedules that create fluctuations in your system.
- Muri (Overburden): Pushing people, machines, or processes beyond their reasonable capacity, leading to breakdowns, defects, and burnout.
- Muda (Waste): The visible inefficiencies we've been discussing - the 8 types of waste in lean themselves.
The relationship works like this: Mura creates the conditions for Muri, which then manifests as Muda.
For example, uneven customer demand (Mura) might lead you to overburden your production system during peak periods (Muri), resulting in defects, overproduction, and waiting (Muda).
This is why simply attacking the visible types of waste in lean manufacturing without addressing their underlying causes often leads to temporary improvements that don't sustain over time.
Sustaining lean waste elimination through intelligent tracking
The reality that most manufacturers discover after their first successful waste reduction initiative is that improvements don't maintain themselves. Without continuous monitoring and data-driven insights, old inefficiencies gradually creep back in.
A real-time analytics layer turns OEE, queue time, and WIP aging into clear, role-based alerts.
The essential metrics that matter for eliminating lean waste:
- Flow and work-in-process visibility: Real-time cycle times, queue lengths, WIP aging analysis, and actual versus target time across all production stages.
- Quality intelligence: First-pass yield rates, defect categorisation with Pareto analysis, cost of poor quality tracking, and customer complaint trend analysis.
- Asset performance: Overall Equipment Effectiveness (OEE) with detailed breakdown of availability, performance, and quality losses, plus predictive maintenance indicators.
- Operational efficiency: Value-added time percentages, cross-training matrix completion, employee suggestion implementation rates, and motion waste indicators from digital work instruction systems.
- Inventory optimisation: Days of supply by category, inventory turn rates, stockout versus excess analysis, and obsolescence risk assessment.
This is where GrowthJockey's expertise in data-driven operational excellence becomes invaluable.
Through our AI-powered platform Intellsys.ai, we help manufacturers connect machine data, MES/ERP systems, and digital work instruction tools into unified intelligence dashboards. Instead of drowning in disconnected data streams, you get role-specific insights delivered exactly when and how you need them.
Our approach enables teams to spot "DOWNTIME" patterns as they develop. More importantly, it provides the data foundation to verify whether your improvement efforts are actually working.
Ready to transform your manufacturing operations from reactive problem-solving to proactive efficiency optimisation? Let's discuss how GrowthJockey - a Full Stack Venture Builder can help you build the data-driven foundation for sustained waste elimination and operational excellence.
FAQs on 8 wastes of lean manufacturing
What's the fastest way to find the 8 wastes in my production line?
Create a current-state value stream map for your main product, add a spaghetti diagram for your busiest workstation, and run a defect Pareto analysis. In just one day, you'll identify the most significant sources of waiting, motion, transportation, and quality waste in your operation.
What is Mura, Muri, and Muda?
In lean manufacturing, Mura refers to unevenness in processes or demand, Muri is overburdening people or machines, and Muda represents waste that adds no value to the customer; addressing Mura and Muri helps eliminate Muda, improving overall efficiency and productivity.
Are the 8 wastes only applicable to manufacturing facilities?
Not at all. Office and service environments experience the same types of waste in lean manufacturing. For example, excessive email approvals represent overprocessing waste, while unused employee suggestions represent non-utilized talent waste. The principles apply universally, though the specific manifestations vary by industry.
How quickly can we expect to see results from waste elimination efforts?
Quick wins, such as better workplace organisation or reduced material handling, can show results within weeks. More substantial improvements involving process redesigns or supplier partnerships typically take 3-6 months to fully implement. However, the measurement and tracking systems should be in place from day one to capture incremental progress.