Look Out for These Top Ten Metrics Involved in Demand Generation Analysis

Did you know that the whole spectrum of B2B marketing and sales initiative depends upon how customers perceive your business? Demand creation piques customer interest in your company's goods or services. It arouses curiosity in those who are unfamiliar with you.
Hence, demand generation in marketing is the process of raising awareness and demand for your goods or service. The objective is to increase your audience, establish your authority, and create interest in your brand so that it generates high-quality leads.
Further, the most successful demand-generation tactics focus on the issues that prospects face and then offer solutions for the same. However, no strategy is successful without keeping a track of the progress. It is vital to measure demand generation to analyse the effectiveness of your demand generation strategy.
If you are a marketing specialist, keep a tab on the following types of demand generation metrics to foster growth.
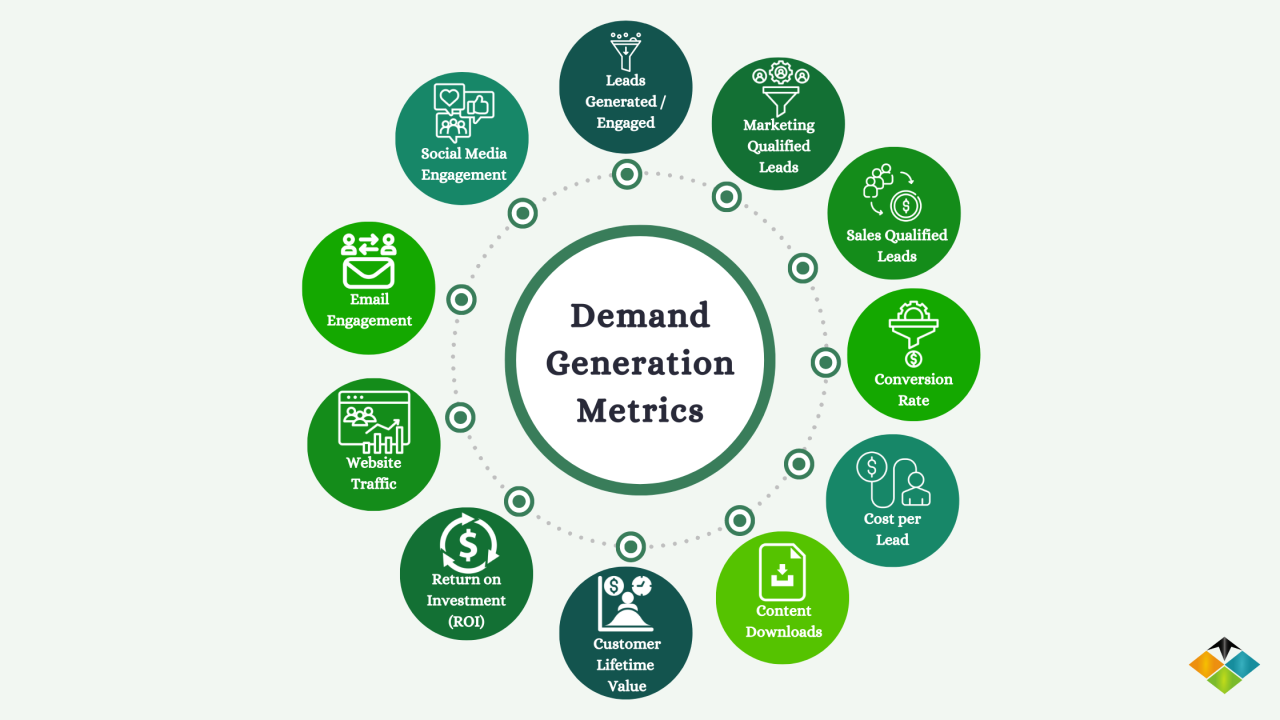
Metrics Involved in Demand Generation
Demand generation includes a broad range of operations that begin even before you've found a client. The process is unending because it continues even after the prospect signs on and converts into a customer. Here are the top ten metrics one should know and the statistics involved in demand generation.
Marketing Qualified Leads (MQLs)
A qualified marketing lead is an important tool for demand generation analysis. The number shows customer interest in your business by engaging with content, providing information and converting into a known lead. These prospects are likely to become customers.
To measure MQLs efficiently, you can do the following -
Set specific goals
The chances of achieving specific goals are higher than general goals. Let’s assume you want to make a few additional lakhs in 2023. Such a goal will push you to generate additional MQLs.
Monitor monthly traffic
It is vital to check whether the web traffic is increasing. At Growth Jockey, we analyze page views, bounce rate, Tweet or Facebook Shares, etc. With these metrics, you can calculate how much web traffic you need to generate for newer leads.
Keep a tab on marketing leads
Checking marketing-oriented customer percentages give a clear picture of what new business came from marketing.
Turn leads into customers
Businesses also need to measure lead-to-customer conversion rates. Typically, it lies between 2% and 5%. By monitoring these numbers weekly, you can assess the quality of your leads. If you're converting traffic to leads, but not into customers, you may not be attracting the right prospects.
Sales Qualified Lead or SQL
Qualified lead marketing metrics let you know about your leads. However, SQL goes one step further and shows prospects who are ready for conversion. SQLs need minimal work for conversions and yet are one of the vital and rending leads.
Similar to MQL, SQL is calculated based on specified metrics such as
-
Number of people visiting the pricing page
-
Number of items added to shopping cart
-
The number of people who register for a free trial or demo
-
The intensity of contacting the sales team
-
Communication with chatbots, etc.
39.5% of marketers believe that access to more accurate data could improve their marketing efforts. Hence, data on SQL leads to personalising marketing campaigns based on keywords, intent data, etc. and quickly converting MQL to SQL. Further, sales teams need to share real-time data and case studies based on SQL.
Cost per Acquisition or CAC
Cost per Acquisition is a great insight into the success of your demand generation strategy. This strategy doesn't always lead to sales. However, the number of customers you acquire and the cost of those sales are attributed to your demand generation strategy.
By tracking the cost per acquisition, you can track how much each customer is spending and reveals the demand for your business. Additionally, Growth Jockey helps analyse cost per lead which relates to potential buyers only. This analysis reveals important opportunities for customization of messaging and content, removing friction, new advertising, and channel experiments.
Customer Lifetime Value or CLTV
Customer Lifetime Value or CLTV is the average customer lifetime value and not individual clients. It reveals the quality of account management and customer retention practices. However, measuring CLTV needs an approach that separates generating SaaS demand and generating informed demand.
For instance, there's no point in creating demand for your business if that demand doesn't translate into sales and referrals. If you generate demand but don't see an increase in the customer's lifetime value, it’s time to reconsider your demand generation strategy.
DMN's Jason Compton said that CLTV is not limited to determining how much to spend to initiate demand generation. It extends to choosing the right acquisition channels and driving customer retention decisions.
Payback Period
Businesses need to track the payback period to ensure that the initial costs and marketing efforts are paying off. Payback time is the time it takes to recover the initial cost of acquiring paying clients.
For a healthy SaaS provider, this period should be no longer than 12 months. The easiest way to calculate the payback period:
CAC / ARPA = Payback Period
ARPA = Average revenue per account every month.
Closing rate
Close rate is a classic sales metric that can provide insight into more than just how your sales team is performing. This is a key indicator of how effectively a company is converting, qualifying, and nurturing marketing-qualified leads.
These rates can also reveal weaknesses in demand generation strategies, such as the tendency of leads to drop in midway. However, businesses must calculate the closing rate for each marketing channel like email, social media, blogs, etc*. Why?*
Each marketing channel has a different CLV, CPA, and budget and hence will differ in results. Further, it allows you to focus on the marketing channels that drive the highest conversion rates for your business. Let's say you get most of your leads from your Facebook and not Instagram.
As a result, you can reallocate budgets accordingly. We at Growth Jockey employ the latest marketing automation to monitor the progress and conversion rates of your marketing campaigns.
Content performance
A study found that nine out of ten B2B buyers say online content has a moderate to major impact on purchasing decisions. When people click on your blog post/download white paper from your website, it indicates an intent to purchase from you.
Therefore, B2B marketers need to invest in dynamic content in their marketing strategy to draw more prospects into the demand generation funnel. Further, each piece of content you share on your website or social network provides different data about customer behaviour.
For example, if someone downloads an e-book from your website, it indicates that they would like to learn more about your product/services. Conversely, if someone follows you on social media, it means they are familiar with your brand but want to learn more.
We at Growth Jockey, employ a strategic approach like targeting different keywords and posting diverse content on your website and social media.
Customer Status at Every Stage
A non-negotiable metric for Ian Marck, Head of Growth at EasyMovie, is the lead status at a stage. The number of days a lead stays at one stage before moving on to the next is vital. The moving can be from MQL to SQL or direct MQL to a client.
This metric helps analysts to figure out how the budget will affect the pipeline. Profits depend not only on the number of leads but also on the speed and duration of the phases. It helps to situate the balance between efficiency and speed.
Average Transaction Size
The average transaction size captured by each demand generation tactic provides value in both new and mature demand marketing scenarios. It helps companies predict revenue and accurately manage pipeline health.
Measuring the average transaction size by buyer persona can give clues about the types of accounts a business should target and prioritize. Lower numbers, but larger deals take longer. Higher volume but lower deal size increases the transaction sales cycle.
If businesses can align their channels with the largest deals and not just the deals that make sales, the chances of smarter decisions increase. It gives a clear picture of where to invest your time and money.
Further, measuring the average deal size and which channels they come from can lead to smarter lead generation decisions eventually. The difference between demand generation and lead generation is based on the goal. Demand generation creates demand or interest in your product or service.
On the other hand, lead generation analysis audits marketing campaigns by collecting information about the rate of lead conversions.
Opportunity Analysis
Marketing and sales teams should regularly analyse closed deals to understand which marketing programs and campaigns impact sales performance. However, the intensity of performing opportunity analysis depends on your customer lifetime value metrics.
Wrapping Up
As a B2B service or product provider, you can boost your business by analysing your demand generation metrics. However, you also need alignment between your sales and marketing divisions. Apart from demand generation metrics, Growth Jockey creates this synergy to spot gaps or blockages in the process, for effective demand generation.
Consequently, the development and evaluation of demand generation strategies work towards successful B2B marketing.
At Growth Jockey, we are dedicated to generating demand for your business through tailored strategies that effectively address the crucial challenges faced by our clients across diverse industries. Regardless of the size of your company, whether it's a small-scale enterprise or a large corporation, you can now tap into the advantages of advanced demand generation techniques. Take the decisive step towards unlocking the next level of growth for your brand by contacting us today!