What is Product Mix? Strategies, Examples & Dimensions

Product mix (also called product assortment or product portfolio) is the full set of products and services a business offers. Getting the mix right determines brand clarity, operational focus, inventory efficiency and profit. For founders, marketers and product teams, the product mix answers strategic questions like: which lines to grow, where to cut, how many SKUs are ideal, and how pricing and bundling influence profitability.
Why this matters today: with faster product cycles and more precise demand signals plus AI-driven portfolio tools, companies can test and rebalance mixes more often, turning product choices from annual bets into continuous optimisation.
What is product mix (definition and scope)
A product mix is the set of product lines and individual products a company sells. It is different from a single product or a campaign - it represents the strategic inventory of what the company stands behind in the market.
Breaking it down clearly:
-
Product line: a related group of products such as running shoes.
-
Product item or SKU: a distinct product such as Running Shoe Model X, size 9, blue.
-
Product mix: all product lines and SKUs together.
Analysing the product mix helps companies prioritise investment, decide which SKUs to discontinue and design bundles or upsells. This becomes even more important as companies compete on product differentiation and product positioning, shaping how customers compare alternatives.
Product mix vs product line
People often confuse product line and product mix; they are related but not interchangeable.
-
A product line is a subgroup of related items such as smartphones.
-
A product mix is the entire portfolio such as smartphones, wearables, accessories and services.
Why this difference matters:
-
Decision framing: Line-level choices such as filling or stretching affect SKU depth, while mix-level choices such as diversification or contraction affect overall breadth.
-
Metrics: Product-line KPIs track market share and cannibalisation. Portfolio-level KPIs track portfolio return, capacity usage and brand coherence.
Founders, marketers and CXOs need both views. Product teams work on tactical line decisions, but investors and leadership evaluate the health of the full mix.
Product Mix Dimensions: width, length, depth, consistency
Every product mix is defined by four key dimensions. Here is an expanded, more practical view.
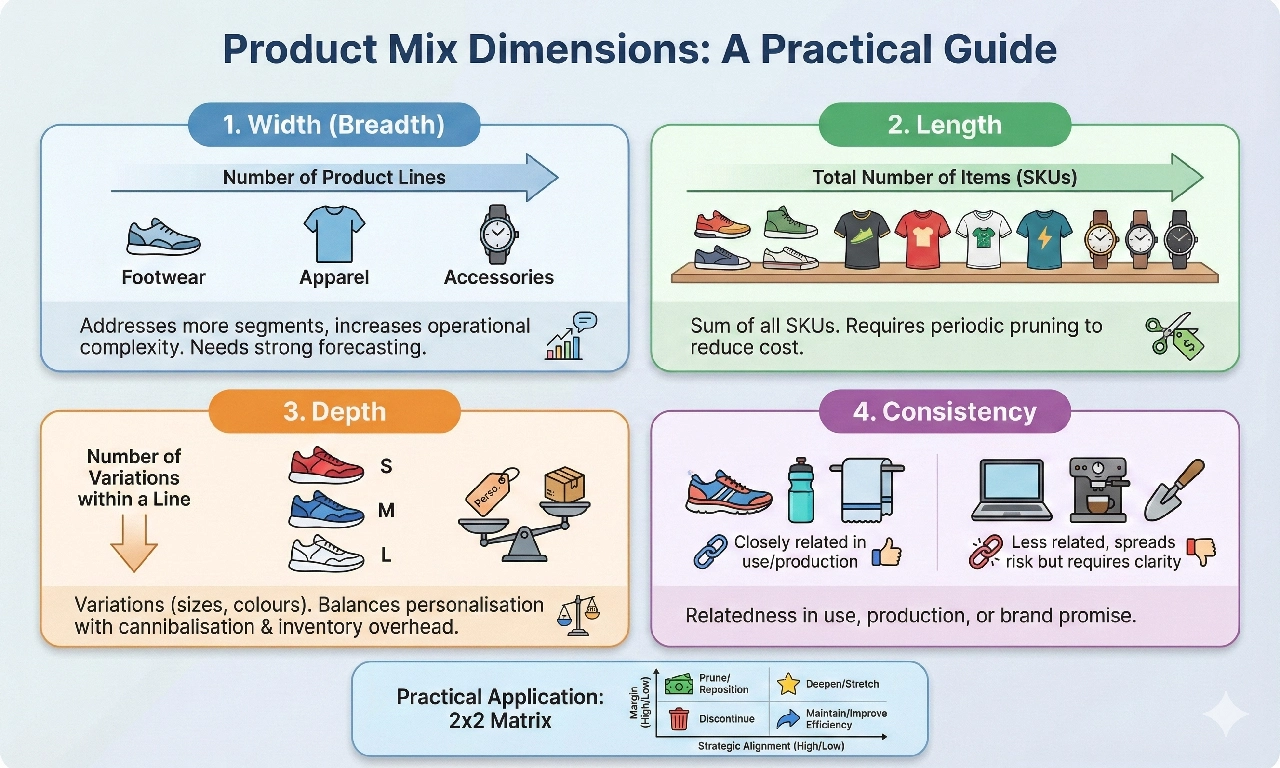
Width (breadth)
This is the number of product lines a company offers. A wider assortment lets a business address more segments but increases operational complexity. Companies with high width need stronger marketing mix modelling and forecasting to avoid demand dilution across categories. Here is an Product line extension example by SleepyHug, a mattress brand.
Length
Length is the total number of items across all product lines (the sum of all SKUs). Companies often accumulate SKUs across years, making SKU audits essential. Longer product mixes benefit from periodic pruning to reduce cost without harming revenue.
Depth
Depth refers to the number of variations within a line (sizes, colours, formulations, configurations). Depth is useful for segmentation and product differentiation, but too much depth creates cannibalisation and inventory overhead. Teams must balance personalisation opportunities with logistics constraints.
Consistency
Consistency is how closely related the product lines are in terms of use-case, production, distribution and brand promise. Highly consistent lines share supply chains and brand messaging. Low-consistency mixes spread risk but require strong organisational clarity and flexible distribution.
A practical way to use these dimensions: map products to a 2x2 matrix of high/low margin and high/low strategic alignment. Decide where to deepen a line, stretch it or prune SKUs based on this map.
Factors affecting product mix
Several internal and external factors shape decisions around the product mix:
-
Market demand and segmentation: changing customer needs, micro-segments and usage contexts drive SKU variations.
-
Product lifecycle stage: ageing or declining products require pruning.
-
Cost and operations: SKU complexity raises procurement, warehousing and returns costs.
-
Brand strategy: premium, value or mass-market positioning sets boundaries for which lines to add or exclude.
-
Distribution channels: e-commerce may support long-tail SKUs; retail shelf space demands curation.
-
Regulation and compliance: especially relevant in sectors such as pharma or finance.
-
Technology and data: AI demand forecasting tools, scenario modelling and SKU rationalisation.
A simple rule for decisions: Expected Contribution = (Incremental Revenue × Probability of Success) – Incremental Cost.
Product-mix strategies (expansion, contraction, diversification, pricing)
Core strategies companies use to evolve their product mix include:
Expansion
Adding new product lines or SKUs to capture adjacent demand. This works well when demand signals are strong and margins justify the investment.
Contraction or pruning
Removing underperforming SKUs or entire lines to simplify operations and boost margin mix.
Diversification
Entering unrelated categories to spread risk. This requires brand justification and operational capability.
Mixed branding and bundling
Companies may introduce sub-brands or bundles to increase take-rate. Bundling low performers with hero products helps lift the sales mix.
Pricing Strategy Alignment
Price lining, value-tiering and psychological pricing influence how customers choose within the mix. Introducing a mid-tier SKU can shift preference upwards by making the premium SKU appear higher value.
Product-line decisions (filling, stretching, length and depth choices)
When managing a line, product teams deal with tactical decisions such as:
-
Filling: adding SKUs between existing price and feature points.
-
Stretching upward or downward: extending a line toward premium or budget-conscious segments.
-
Depth adjustments: increasing or reducing variants within the same product line.
Evaluate these choices by measuring cannibalisation, contribution margin and incremental demand before committing to new SKUs.
Pricing and product mix considerations
Pricing is closely tied to product mix design. Important considerations include:
-
Price lining: creating tiered SKUs to simplify choice and guide buyers.
-
Bundle pricing: improving take-rate and average order value.
-
Promotional mix planning: discount frequency on certain SKUs influences the expected sales mix.
-
Margin-weighted sales mix: the goal is to shift sales toward higher-margin items, not just volume.
Use sales-mix variance analysis to evaluate how mix changes impact overall profitability.
Measuring performance: sales mix, profitability, SOV
Measuring the performance of a product mix requires deeper visibility into portfolio behaviour.
Sales mix
Sales mix shows what percentage of total revenue comes from each product or line. High-performing businesses monitor weekly or even daily shifts in mix. Advanced teams overlay channel-wise and cohort-wise breakouts to see how behaviour changes across customer types.
Profitability
Profitability analysis includes:
-
Contribution margin for each SKU
-
Gross margin shifts caused by mix changes
-
Promo elasticity and return rates
-
Cannibalisation and cross-sell effects across lines
Analysing profitability at the mix level rather than just product level helps prioritise which SKUs deserve marketing, engineering and distribution investment.
Share of Voice (SOV)
SOV reflects your category presence across marketing channels. Higher SOV typically correlates with higher market share over time. Evaluating SOV by product line reveals where investment gaps exist and where product positioning needs reinforcement.
A robust measurement setup integrates marketing mix modelling for forecasting the impact of product mix changes on demand, acquisition cost and portfolio-level ROI.
Case studies and examples
1. FMCG: A major FMCG company reduced SKUs by double digits across beverages and increased gross margins by focusing on high-velocity SKUs and removing regional low-velocity variants.
2. Software or SaaS: SaaS companies often merge features into tiered plans, effectively reducing SKU fragmentation and simplifying engineering load.
3. Retail apparel: Online channels maintain long-tail variants, while offline stores hold curated assortments to minimise inventory risk and returns.
Always test mix changes in small markets or controlled channels to minimise risk.
Implementation checklist
-
Map your full product mix with SKU counts and contribution margins.
-
Tag each SKU by strategic fit: core, adjacent or experimental.
-
Analyse SKU-level economics including promo elasticity and return rates.
-
Prioritise experiments such as bundles, price-line additions or regional tests.
-
Track daily sales-mix shifts, margin movement and SOV changes.
-
Create governance rules for new SKU introductions.
-
Use AI for demand forecasting, cannibalisation modelling and SKU rationalisation.
How GrowthJockey Can Help
GrowthJockey - Full Stack Venture Builder helps companies validate, build and scale product portfolios with AI-driven venture architecture. The team turns customer-intent signals, unit economics, competitor analysis and feasibility constraints into a prioritised and testable product roadmap.
This includes forecasting demand, modelling scenarios, refining product positioning, deciding where to stretch or prune and ensuring your portfolio choices are supported by data. GrowthJockey integrates structured experimentation with strategic portfolio thinking to guide businesses toward higher-margin, higher-clarity product mixes.
Conclusion and recommendations
Product mix is both a strategic asset and an operational cost. Treat it like a portfolio: measure expected contribution, test changes in controlled markets and apply data to shorten decision cycles. Target SKU simplification where cost outweighs value, and use bundling or price lining to shift sales toward higher-margin SKUs.
A simple starting point is to run a 90-day SKU audit, tag every SKU by margin and strategic fit, and test three portfolio moves such as one bundle, one price-line shift and one prune test.
FAQs
Q1. What is the difference between product mix and product line?
A product line is a group of related products, while a product mix is the entire set of product lines and items a company offers. Product mix represents the full portfolio, while product line is just one branch of it.
Q2. What are the four dimensions of the product mix?
Width, Length, Depth and Consistency.
Q3. What are the four product mix strategies?
Expansion, Contraction, Diversification and Branding or Bundling adjustments.
Q4. What are the 7 Ps of a product mix?
Product, Price, Place, Promotion, People, Process and Physical Evidence.