How are Sales Analytics Apps Turning Data into Revenue Growth | Intellsys AI

Sales once ran on gut instinct; now, teams need data at every step. With everything automated, data is pouring in from every interaction with prospects. Therein comes a need to add a management software that sorts everything for you, sales analytics.
But what is sales analytics really? It collects, unifies, and analyses this type of data coming from CRMs, email platforms, and spreadsheets to show teams which deals to prioritise.
Analytics tools and apps help improve forecasting and reveal where pipeline gaps hide, all in real time. Organisations with consistent access to real‐time data report 50% higher revenue growth and net margins than those without, and 73% of salespeople using AI-powered CRM systems say analytics have increased team productivity.
In this blog, you’ll get a simple guide for why you need sales analytics apps, choosing the right one, and rolling it out so your employees can start using it.
Why sales analytics apps are critical for modern revenue growth
You’re the head of sales at a fast-growing startup. Your sales reps send hundreds of emails, run demos, and your marketing team spins up ad campaigns. But revenue dips, and no one knows why.
Sales analytics apps are dashboard tools that shine a light on these blind spots, turning scattered touchpoints into a clear story that employees and teams can act on.
The revenue attribution challenge
Data comes in bulk. CRM logs opportunities, email tools record outreach, and social platforms track clicks. Without a view of them all put together, teams can’t trace which actions are for pipelines and which ones forecast accurately.
Sales analytics apps solve the “revenue black box” by stitching every touchpoint: calls, emails, ad clicks, and social interactions into one dashboard, so employees see exactly which campaigns and channels attract deals.
The hidden revenue leaks that analytics apps reveal
Even strong sales teams lose deals without realising it. Maybe your team chases the wrong leads because the lead scores are off. Or deals stall when moving from one step to the next, like after a demo, yet nobody spots the drop.
Some reps close quickly, others drag their feet, but average numbers hide both star performers and those who need help. Many times, busy seasons or slow months blur together in old reports.
Your team can make data-driven sales decisions by shining a light on these issues: it shows where deals slow down, highlights which reps need training, and points out patterns over time so teams can fix problems before they cost money.
From reactive to predictive: the analytics advantage
Old reports only tell you what went wrong after it’s too late. A predictive sales analytics software gives you live dashboards and simple alerts when deals start to stall.
You’ll see which opportunities need a push, and get clear estimates on when deals are likely to close. That lets you move reps or shift resources before problems grow. Instead of scrambling to fix missed targets, teams can plan ahead with confidence, and hit their goals more often.
Essential features every sales analytics platform should have
Sales analytics platforms must include core sales functions that turn raw data into growth potential. These platforms power analytical sales and services with software and tools that include:
1. Unified data integration
This core feature of a sales analytics app pulls in data from CRMs, email outreach tools, social platforms, web forms, and spreadsheets into one central dashboard. So no employee has to hop apps to see different results.
2. Real-time visibility
Live dashboards show exactly where deals sit within the sales funnel, with instant alerts for stalled opportunities so teams can act before a deal cools off.
3. Conversion analytics by stage and rep
This means you can compare rep-to-sales performance by stage side by side. It shows which employee needs training for which stage of the sale (XYZ needs more focus on closing, and ABC needs outreach training).
4. Revenue attribution across channels
Assign revenue back to the campaigns, channels, and touchpoints that created it, so you know which marketing or sales efforts are bringing in the most revenue.
5. 360-degree customer journey tracking
This feature allows you to follow prospects from first contact to renewal. Seeing all emails, calls, demos, and support in one timeline ensures nothing falls through the cracks.
6. Automated report generation
If you’re in a last-minute pitch, you could schedule custom reports and dashboards to arrive in inboxes whenever you choose. This feature cuts manual report builds and meeting-prep headaches.
Pro tip: Schedule weekly automated “health check” reports for key metrics: pipeline velocity, win rates, CAC, to proactively keep executives aligned without any manual effort.
Integration capabilities for existing workflows
A sales analytics platform is only as good as the data feeding it. Ensure your analytics tool offers connectivity with your existing CRM, marketing automation, and support tool stack.
Moreover, the connectivity should be completely automated and synced in real time to pull updates to the live dashboard. Small teams, especially, should always be on guard.
Did you know: A McKinsey study[1] shows that 45% of tasks can be automated, with machine learning being able to do 80% of those. So, don’t choose any data management platform that requires manual entries, as it would be time-wasting.
Ability to set actionable insights vs. vanity metrics
Steer clear of vanity metrics like total emails sent or raw page views, unless you can tie them directly back to closed-won revenue. Choose apps that give you actionable insights that can guide teams on where to double down, who to coach, and which channels to scale for the biggest impact.
Here’s a quick reference table to spot actionable insights versus vanity metrics on your sales analytics platform:
| Criterion | Actionable indicators | Vanity indicators |
|---|---|---|
| Revenue or efficiency link | “These 20 deals stalled at Demo → Proposal last week, costing you $120 K in potential revenue.” | “Your Demo stage is underperforming.” |
| Clear next step | “Increase follow-up cadences for deals stuck > 5 days.” | “Demo conversion dropped 8%.” |
| Timeframe & context | “Compared to your 90-day average, email responses are down 12%.” | “Your email open rate is low.” |
| Confidence & sample size | “Based on 150 deals—95% confidence this trend holds.” | “You will lose 30% of deals.” |
| Root causes or correlations | “Deals with no recorded second call drop win rates by 24%.” | “Your reps need more training.” |
| Data source transparency | “This finding uses CRM + email logs from the past month.” | “Our AI says…” |
Top sales analytics apps driving revenue growth in 2025
Now we know the features to look for in an analytics software - but which ones are best for what size of teams? Choosing the right analytics app can make or break your growth plans, so weigh your options before diving in.
Below are leading platforms, grouped by category, with details on their capabilities, implementation timelines, and ideal use cases:
1. Intellsys - AI-powered revenue intelligence
Suited for: Teams of all sizes that need an intelligent data management platform.
Intellsys is an AI-first revenue intelligence platform that unifies sales, marketing, and operational data into one coherent model.
The intelligence comes in when it applies machine learning to predict deal outcomes, recommend next-best actions, and auto-assign revenue credit across every channel.
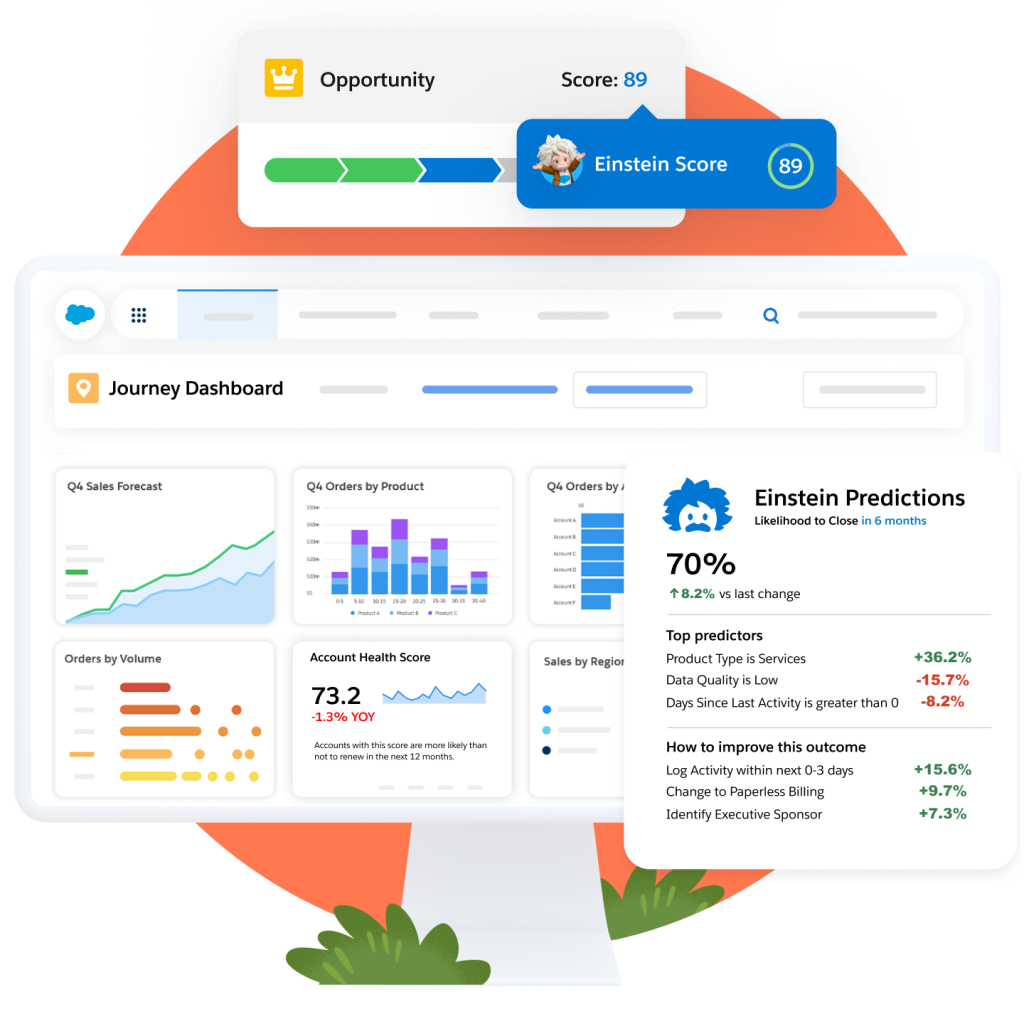
2. Salesforce Analytics Cloud - Enterprise-grade platforms
Best for: Teams that need enterprise-wide data analytics with intelligence, global teams running multiple sales motions under one roof.
Salesforce Analytics Cloud combines native CRM records with marketing, service, and commerce data. It includes customisable dashboards, AI-driven forecasting, and complex territory modelling, handling millions of records.
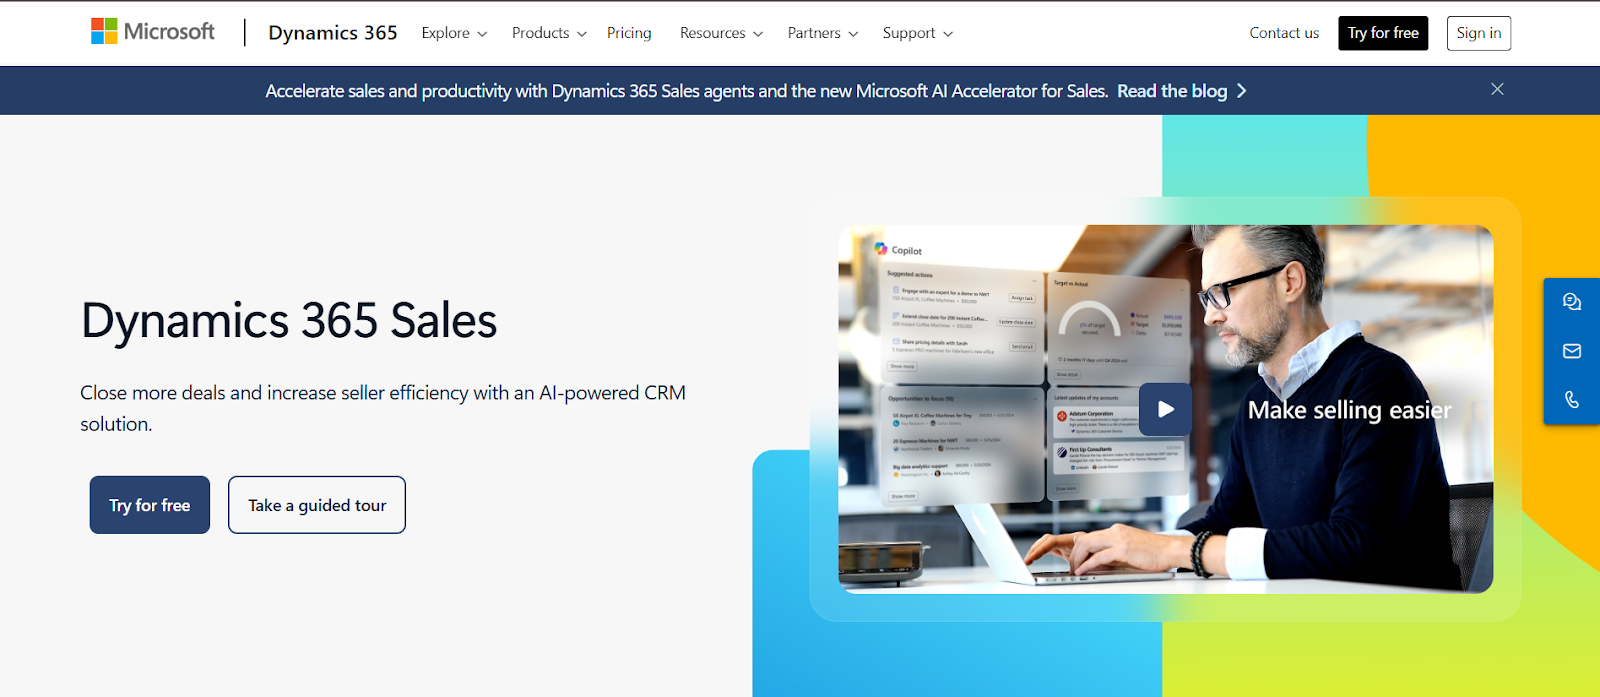
3. Microsoft Dynamics 365 Sales Insights
Dynamics 365 Sales Insights brings advanced analytics directly into Microsoft’s ecosystem. It enriches CRM data with AI-powered relationship health scores, predictive lead and opportunity scoring, and conversation intelligence from Teams and Outlook.
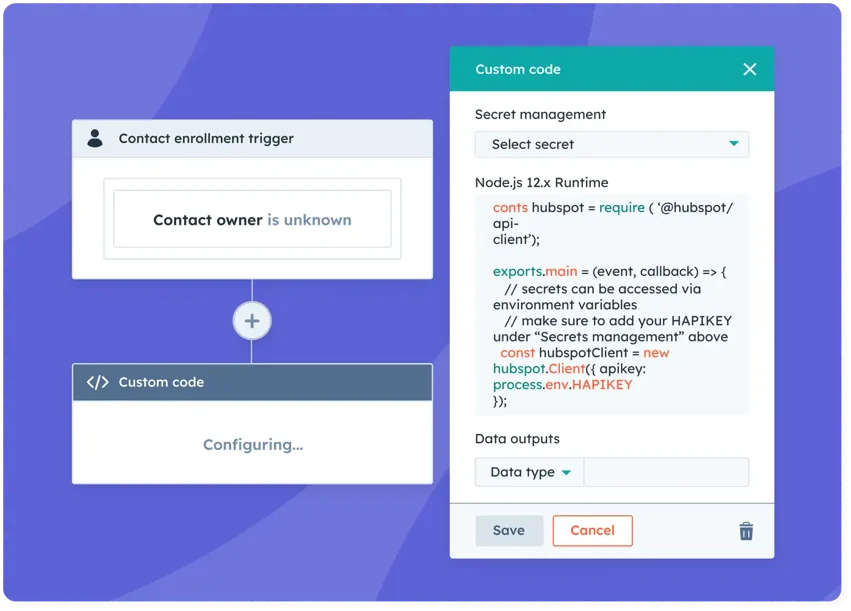
4. HubSpot Operations Hub - Mid-market solutions
Who can use: Mid-market organisations that need powerful analytics without heavy IT overhead, scaling teams on tight budgets.
HubSpot Operations Hub unifies CRM records, marketing emails, customer feedback, and custom objects into a single data store.
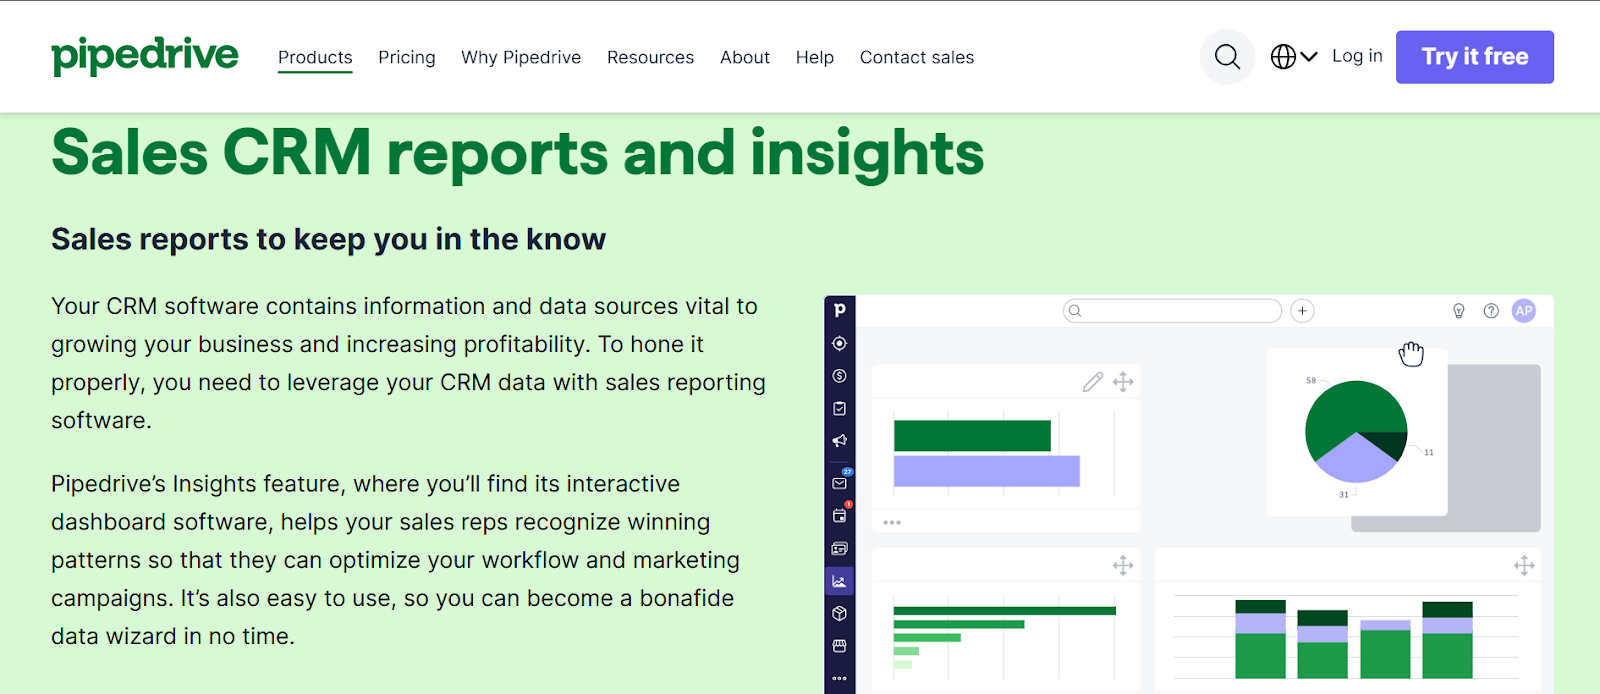
5. Pipedrive Insights
Pipedrive Insights focuses on visual simplicity and swift time to value. It pulls CRM data into intuitive charts that highlight deal stage conversion rates, average cycle length, and rep performance heatmaps.
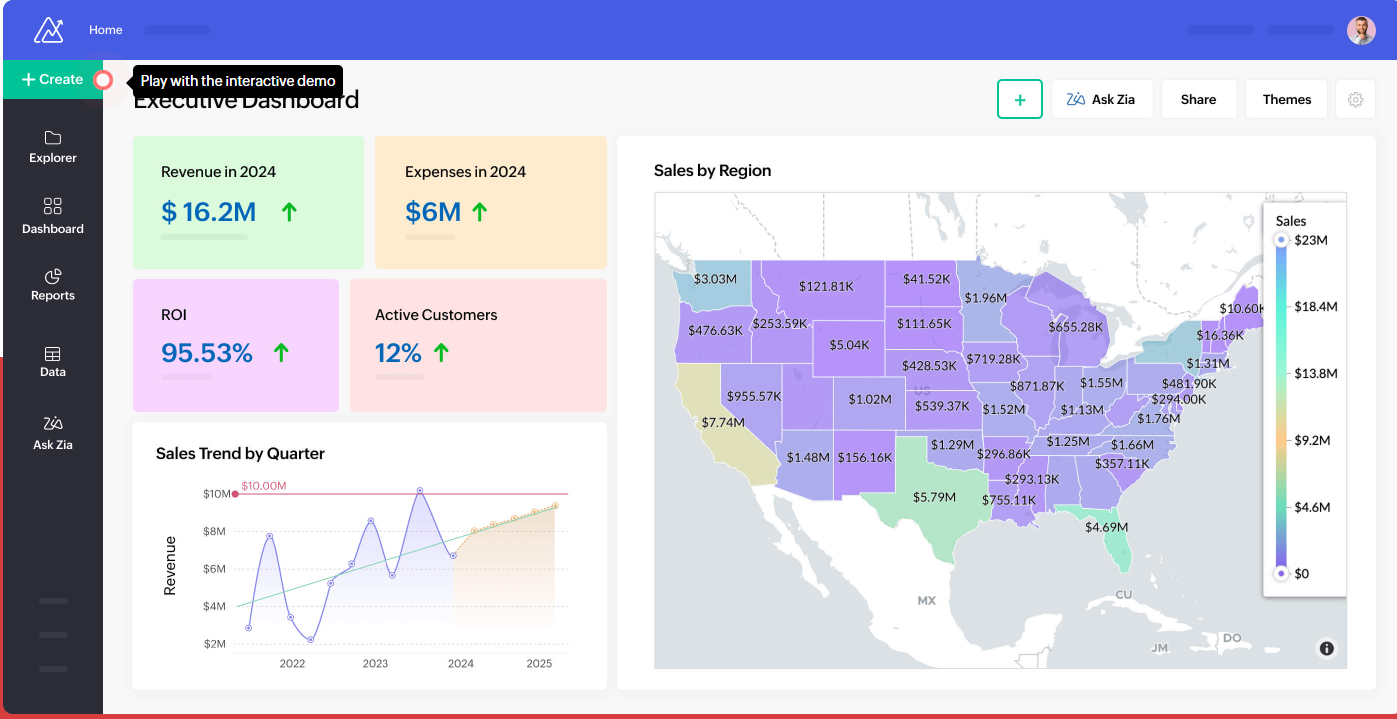
6. Zoho Analytics
Zoho Analytics offers a drag-and-drop report builder, AI-powered “Ask Zia” natural-language querying, and over 100 prebuilt connectors (including CRMs, email, and social platforms).
Getting started: Your next steps to revenue-driven sales analytics
Getting started on a revenue-driven sales analytics strategy means choosing a platform that aligns with your team’s needs and committing to an action-oriented rollout. Here’s what you need to do after moving to a sales analytics platform:
Begin by mapping every data source: CRM, email, social, web forms, and identifying the gaps that often hide stalled deals or misattributed revenue. An AI-powered predictive sales analytics tool like Intellsys.ai can speed up this process as it brings predictive forecasting, next-best-action nudges, and unified attribution together in one low-code dashboard.
Next, run a focused pilot with a small group of reps for 4-6 weeks, tracking metrics such as pipeline velocity and deal-stage conversion. Use those insights to refine your workflows, tweak data integrations, and build internal buy-in. As you scale, automate report delivery to keep stakeholders aligned without extra effort.
FAQs on Sales Analytics Apps
1. How to analyse sales data?
-
Collect and clean data from all sources (CRM, spreadsheets, email).
-
Segment by region, product, and rep.
-
Calculate key metrics: conversion rates, average deal size, pipeline velocity, and visualise trends via charts.
-
Drill into anomalies, perform cohort analysis, and use predictive models to forecast growth.
2. How to track your sales using Google Analytics?
Enable Enhanced Ecommerce or Goals to capture transaction and lead data. Tag marketing campaigns with UTM parameters. Set up funnels for key steps (e.g., landing page → form → purchase). Monitor Conversions, Behaviour Flow, and Multi-Channel Funnels reports to see which channels drive revenue.
Check out our guide to Google Analytics basics
3. What is the sales funnel analytics dashboard?
It is a centralised interface that maps each stage: lead, qualified opportunity, proposal, close, displaying conversion rates, average time in stage, and drop-off points.
It highlights bottlenecks by stage and rep, allowing teams to optimise processes, forecast pipeline health, and prioritise deals that need attention.
4. What is sales analytics app used for?
An analytics app unifies fragmented sales data (CRM, email, web) into one dashboard. It visualises performance metrics, attributes revenue to touchpoints, and offers predictive forecasts. Teams use it to spot bottlenecks, coach reps, automate reports, and make data-driven decisions that drive consistent growth.